Centralized Network Management Dashboard
A writeup on Building a Centralized Network Management Dashboard for Multiple WiFi Hotspot Deployments.
Building a Centralized Network Management Dashboard for Multiple WiFi Hotspot Deployments
Introduction
Managing multiple WiFi hotspot deployments across different locations can be challenging. Each site runs critical services like CoovaChilli, FreeRADIUS, MySQL, and Apache, and monitoring them manually is time-consuming and error-prone. In this article, I’ll walk you through a SuperAdmin Dashboard system I built to centrally monitor and manage dozens of Mini PC-based hotspot deployments from a single interface.
The Problem
When you’re managing WiFi hotspots for multiple clients, you face several challenges:
- No visibility into device health without SSH-ing into each machine
- Manual service restarts require connecting to each device individually
- No centralized metrics for bandwidth usage, active users, or system resources
- Reactive troubleshooting - you only know something’s wrong when clients complain
- Security concerns with giving clients direct access to their devices
The Solution: SuperAdmin Dashboard + Mini PC Agents
The solution consists of two main components:
1. SuperAdmin Dashboard (Central Control)
A web-based dashboard that provides real-time monitoring and remote management capabilities.
2. Mini PC Agents (Deployed on Each Site)
Lightweight FastAPI agents running on each Mini PC that report metrics and execute remote commands.
Architecture Overview
1
2
3
4
5
6
7
8
9
10
11
12
13
14
15
16
17
18
19
20
┌─────────────────────────────────────────────────────────────┐
│                    SuperAdmin Dashboard                     │
│              (FastAPI + PostgreSQL + Auth)                  │
│                   https://admin.example.com                 │
└───────────────────────┬─────────────────────────────────────┘
                        │
                        │ Tailscale VPN (100.x.x.x)
                        │
        ┌───────────────┴───────────────┬─────────────────┐
        │                               │                 │
┌───────▼────────┐              ┌──────▼──────┐   ┌─────▼──────┐
│   Mini PC #1   │              │ Mini PC #2  │   │ Mini PC #N │
│   Agent:8765   │              │ Agent:8765  │   │ Agent:8765 │
│                │              │             │   │            │
│ • CoovaChilli  │              │ Services:   │   │ Services:  │
│ • FreeRADIUS   │              │ • Chilli    │   │ • Chilli   │
│ • MySQL        │              │ • RADIUS    │   │ • RADIUS   │
│ • Apache       │              │ • MySQL     │   │ • MySQL    │
└────────────────┘              └─────────────┘   └────────────┘
   Client Site A                 Client Site B     Client Site C
All communication happens over Tailscale VPN, ensuring secure, encrypted connections without exposing services to the public internet.
Core Features
🎯 Real-Time Monitoring
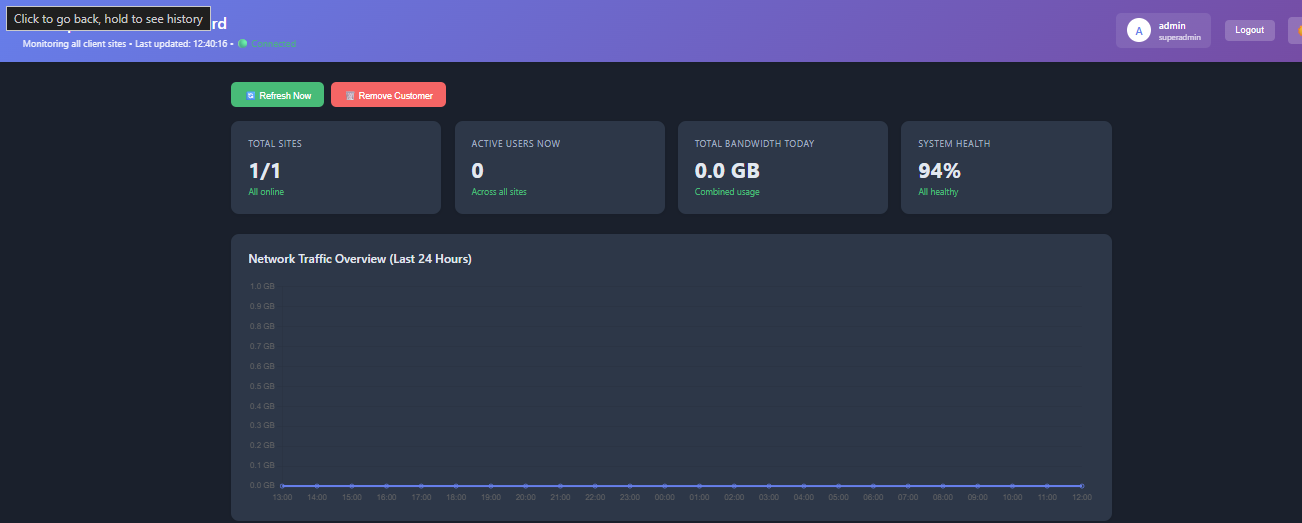
The dashboard provides a comprehensive overview of all deployments:
Overview Statistics:
- Total sites online/offline
- Active users across all sites
- Total bandwidth consumption
- System health scores
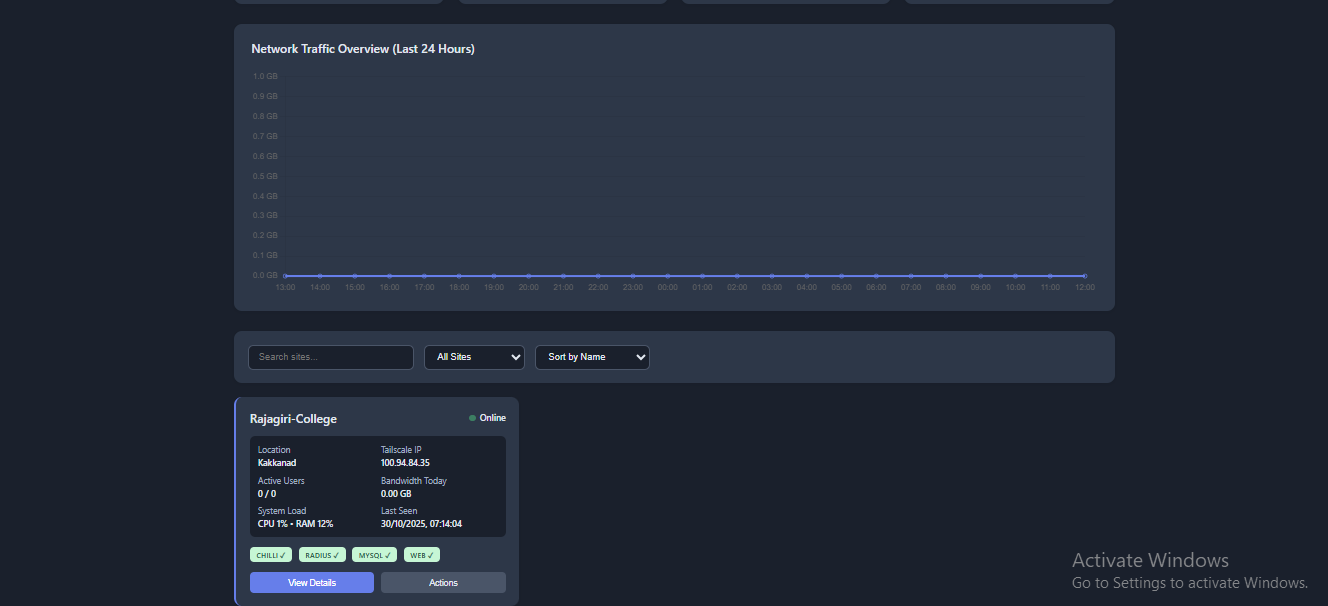
Per-Site Metrics:
- CPU, RAM, and Disk usage
- Active vs. total users
- Daily bandwidth (upload/download)
- Service status (Chilli, RADIUS, MySQL, Apache)
- Last seen timestamp
Network Traffic Visualization:
- 24-hour bandwidth usage graph using Chart.js
- Hourly breakdowns for capacity planning
- Visual identification of traffic patterns
🔧 Remote Management
Execute actions on any Mini PC without SSH:
Service Management:
- Restart CoovaChilli, FreeRADIUS, or other services
- View real-time service logs
- Check service status and health
System Operations:
- Remote device reboot
- Execute shell commands via web terminal
- View system logs and diagnostics
Web Terminal:
- Full shell access through the browser
- Command history (up/down arrows)
- Safe command execution with timeout protection
- Blocked dangerous commands (like
rm -rf /)
👥 Multi-User Authentication
Role-Based Access Control:
- Superadmin - Full access to all features
- Admin - Manage customers and perform actions
- Viewer - Read-only access to metrics
Security Features:
- JWT-based authentication
- Bcrypt password hashing
- Session management with token expiration
- Default password warning system
- Password change enforcement
📊 Customer Management
- Add/edit/delete customer deployments
- Track contact information and locations
- Device registration and identification
- Automatic device discovery via Tailscale
- Historical data retention
🌓 User Experience
- Dark Mode - Toggle between light and dark themes
- Responsive Design - Works on desktop, tablet, and mobile
- Real-Time Updates - Auto-refresh every 30 seconds
- Smart Filtering - Search, filter by status, sort by metrics
- Connection Status Indicator - Know when the backend is unavailable
Technical Stack
Backend (SuperAdmin API)
Framework: FastAPI (Python)
- Asynchronous request handling
- Automatic API documentation
- Type validation with Pydantic
- High performance
Database: PostgreSQL
- Time-series metrics storage
- Customer and device management
- Audit logging for compliance
- Automated cleanup tasks
Authentication:
- Jose (JWT tokens)
- Passlib (bcrypt hashing)
- HTTP Bearer token security
Key Libraries:
asyncpg- Async PostgreSQL driverhttpx- Async HTTP client for agent communicationpython-multipart- Form data handling
Frontend (Dashboard UI)
Pure HTML/CSS/JavaScript - No framework overhead
- Vanilla JavaScript for maximum compatibility
- Chart.js for visualizations
- Responsive CSS Grid layout
- Modern ES6+ features
Design:
- Clean, professional interface
- Gradient headers and hover effects
- Color-coded status indicators
- Loading states and error handling
Mini PC Agent
FastAPI-based Agent:
- Lightweight HTTP server on port 8765
- Executes remote commands securely
- Reports metrics to central dashboard
- Handles service restarts and reboots
Metrics Collection:
- CPU, RAM, Disk usage via
psutil - Active users from CoovaChilli sessions
- Bandwidth from network interfaces
- Temperature monitoring (where available)
Security Implementation
🔐 Network Security
Tailscale VPN:
- All communication over encrypted Tailscale mesh network
- No public internet exposure of agents
- Automatic NAT traversal
- Device authentication via Tailscale keys
Zero-Trust Architecture:
- Each Mini PC only accessible via Tailscale IP (100.x.x.x)
- No port forwarding required
- Encrypted communication by default
🛡️ Application Security
Authentication:
1
2
3
4
5
# JWT token with 8-hour expiration
access_token = create_access_token(
    data={"sub": username, "role": user_role},
    expires_delta=timedelta(minutes=480)
)
Password Security:
- Bcrypt hashing with salt rounds
- Minimum password length enforcement
- Default password warning system
- Force password change on first login
Authorization:
1
2
3
# Role-based access control
if current_user['role'] not in ['superadmin', 'admin']:
    raise HTTPException(status_code=403, detail="Insufficient permissions")
Command Execution Safety:
- Blacklist of dangerous commands
- 30-second timeout on all commands
- No direct root shell access
- Sudo required for privileged operations
📝 Audit Logging
All important actions are logged:
1
2
INSERT INTO audit_log (user_id, action, entity_type, entity_id, details)
VALUES ($1, 'permanent_delete_customer', 'customer', $2, $3)
Tracked events:
- Customer creation/modification/deletion
- Remote actions executed
- Service restarts and reboots
- Login attempts and password changes
- Configuration changes
🔒 API Security
Rate Limiting:
- Connection retry with exponential backoff
- Max 3 retries before alerting
- Prevents API abuse
Input Validation:
- Pydantic models for all inputs
- SQL injection prevention via parameterized queries
- XSS protection with proper escaping
- CORS configuration for trusted origins
Database Schema Highlights
Core Tables
customers - Client site information
1
2
3
4
5
6
7
8
9
10
CREATE TABLE customers (
    id SERIAL PRIMARY KEY,
    name VARCHAR(255) NOT NULL,
    location TEXT,
    tailscale_ip VARCHAR(50) UNIQUE,
    device_id VARCHAR(100) UNIQUE,
    status VARCHAR(20) DEFAULT 'active',
    last_seen TIMESTAMP,
    created_at TIMESTAMP DEFAULT NOW()
);
device_metrics - Time-series performance data
1
2
3
4
5
6
7
8
9
10
11
CREATE TABLE device_metrics (
    id BIGSERIAL PRIMARY KEY,
    customer_id INTEGER REFERENCES customers(id) ON DELETE CASCADE,
    cpu_usage FLOAT,
    ram_usage FLOAT,
    disk_usage FLOAT,
    active_users INTEGER,
    bandwidth_upload_gb FLOAT,
    bandwidth_download_gb FLOAT,
    timestamp TIMESTAMP DEFAULT NOW()
);
remote_actions - Action execution history
1
2
3
4
5
6
7
8
9
CREATE TABLE remote_actions (
    id BIGSERIAL PRIMARY KEY,
    customer_id INTEGER REFERENCES customers(id),
    action_type VARCHAR(50),
    action_params JSONB,
    result TEXT,
    executed_by VARCHAR(100),
    executed_at TIMESTAMP DEFAULT NOW()
);
alerts - Automated monitoring alerts
1
2
3
4
5
6
7
8
9
CREATE TABLE alerts (
    id SERIAL PRIMARY KEY,
    customer_id INTEGER REFERENCES customers(id),
    alert_type VARCHAR(50),
    severity VARCHAR(20),
    message TEXT,
    resolved BOOLEAN DEFAULT FALSE,
    created_at TIMESTAMP DEFAULT NOW()
);
Automatic Cleanup
Old data is automatically cleaned up:
1
2
DELETE FROM device_metrics WHERE timestamp < NOW() - INTERVAL '30 days';
DELETE FROM remote_actions WHERE executed_at < NOW() - INTERVAL '90 days';

How It Works
Device Registration Flow
- Mini PC boots up with agent installed
- Agent detects Tailscale IP and hostname
- Agent POSTs registration to SuperAdmin API:
1
2
3
4
5
6
7
{
  "hostname": "minipc-client-a",
  "tailscale_ip": "100.64.1.5",
  "device_id": "uuid-12345",
  "customer_name": "Client A Hotspot",
  "location": "Downtown Office"
}
- SuperAdmin creates customer record
- Device appears in dashboard immediately
Metrics Reporting
Every 60 seconds, the agent sends metrics:
1
2
3
4
5
6
7
8
9
10
11
12
13
metrics = {
    "cpu_usage": 45.2,
    "ram_usage": 62.8,
    "disk_usage": 38.5,
    "active_users": 12,
    "bandwidth_upload_gb": 2.3,
    "bandwidth_download_gb": 5.7
}

await httpx.post(
    f"{SUPERADMIN_API}/metrics/{customer_id}",
    json=metrics
)
Remote Action Execution
When you click “Restart RADIUS” in the dashboard:
- Dashboard sends authenticated request:
1
2
3
4
5
6
7
8
9
10
11
fetch(`${API_BASE_URL}/customers/${customer_id}/action`, {
 method: 'POST',
 headers: {
     'Authorization': `Bearer ${accessToken}`,
     'Content-Type': 'application/json'
 },
 body: JSON.stringify({
     action_type: 'restart_service',
     service_name: 'freeradius'
 })
})
- SuperAdmin API forwards to agent:
1
2
3
4
5
async with httpx.AsyncClient() as client:
 response = await client.post(
     f"http://{tailscale_ip}:8765/action",
     json=action.dict()
 )
- Agent executes command:
1
2
3
4
5
subprocess.run(
 ["sudo", "systemctl", "restart", "freeradius"],
 capture_output=True,
 timeout=30
)
- Result returned to dashboard and logged
Deployment Guide
Prerequisites
- PostgreSQL 14+ database
- Python 3.9+ with FastAPI
- Tailscale account and devices
- Mini PCs with Ubuntu/Debian
SuperAdmin API Setup
1
2
3
4
5
6
7
8
9
10
11
12
13
14
15
16
17
18
19
20
# Clone repository
git clone https://github.com/yourusername/superadmin-dashboard.git
cd superadmin-dashboard

# Create virtual environment
python3 -m venv venv
source venv/bin/activate

# Install dependencies
pip install fastapi uvicorn asyncpg httpx passlib python-jose bcrypt

# Set environment variables
export DATABASE_URL="postgresql://user:pass@localhost/superadmin"
export SECRET_KEY="your-secret-key-here"

# Initialize database
psql -U user -d superadmin -f schema.sql

# Run API server
uvicorn main:app --host 0.0.0.0 --port 8000
Mini PC Agent Setup
1
2
3
4
5
6
7
8
9
# On each Mini PC
sudo apt update
sudo apt install python3-pip

# Install agent
pip3 install fastapi uvicorn psutil httpx

# Create systemd service
sudo nano /etc/systemd/system/superadmin-agent.service
1
2
3
4
5
6
7
8
9
10
11
12
13
[Unit]
Description=SuperAdmin Agent
After=network.target

[Service]
Type=simple
User=root
WorkingDirectory=/opt/superadmin-agent
ExecStart=/usr/local/bin/uvicorn agent:app --host 0.0.0.0 --port 8765
Restart=always

[Install]
WantedBy=multi-user.target
1
2
3
# Enable and start
sudo systemctl enable superadmin-agent
sudo systemctl start superadmin-agent
Frontend Deployment
1
2
3
4
5
6
# Serve via Nginx or Apache
sudo cp index.html /var/www/html/admin/
sudo cp login.html /var/www/html/admin/

# Update API_BASE_URL in both files
# to point to your SuperAdmin API
Performance Considerations
Database Optimization
Indexes for fast queries:
1
2
3
CREATE INDEX idx_device_metrics_customer_time
    ON device_metrics(customer_id, timestamp DESC);
CREATE INDEX idx_customers_status ON customers(status);
Connection pooling:
1
2
3
4
5
db_pool = await asyncpg.create_pool(
    DATABASE_URL,
    min_size=5,
    max_size=20
)
Async Everything
All I/O operations are asynchronous:
- Database queries via
asyncpg - HTTP requests via
httpx.AsyncClient - Background monitoring tasks via
asyncio
This allows handling hundreds of devices efficiently with minimal resources.
Frontend Optimization
- No heavy frameworks - Pure JavaScript keeps bundle size minimal
- Lazy loading - Charts only render when data is available
- Debounced searches - Reduces unnecessary filtering
- Auto-refresh - Only when tab is active
Monitoring & Alerting
Automatic Alert Generation
The system automatically creates alerts for:
- Device offline - No metrics received for 5+ minutes
- High CPU - CPU usage above 80% for 10+ minutes
- High RAM - Memory usage above 85%
- Disk space - Disk usage above 90%
- Service down - Critical service not responding
Alerts are stored and can trigger notifications (email, Slack, etc.).
Health Scoring
Each device gets a health score (0-100):
1
2
3
4
health = 100
    - (cpu_usage * 0.3)
    - (ram_usage * 0.3)
    - (disk_usage * 0.2)
Sites with low health scores are highlighted for attention.
Future Enhancements
Planned Features
- Email/SMS Alerts - Notifications when devices go offline
- Mobile App - Native iOS/Android monitoring app
- Grafana Integration - Advanced time-series visualization
- Backup Management - Automated config and database backups
- Bulk Actions - Restart services on multiple sites at once
- Custom Dashboards - Per-client branded portals
- API Webhooks - Integrate with external monitoring tools
- 2FA Authentication - Additional security layer
- Client Portal - Limited self-service interface for customers
Scalability
The current architecture easily handles:
- 100+ devices with sub-second response times
- Millions of metrics with proper database indexing
- Concurrent actions across multiple sites
- High availability with load balancing and failover
Lessons Learned
What Worked Well
✅ Tailscale VPN - Made secure networking trivial
✅ FastAPI - Rapid development with excellent performance
✅ PostgreSQL - Rock-solid reliability for time-series data
✅ Async Python - Handles many concurrent connections efficiently
✅ JWT Auth - Stateless authentication scales perfectly
Challenges Overcome
⚠️ Connection resilience - Implemented retry logic with exponential backoff ⚠️ Command timeouts - Added 30-second limits to prevent hanging ⚠️ Cascading deletes - Proper foreign key constraints prevent orphaned data ⚠️ Dark mode - Required careful CSS planning for all UI states
Conclusion
Building a centralized management dashboard has transformed how we handle multiple WiFi hotspot deployments. What used to take hours of SSH sessions and manual checks now happens in seconds through an intuitive web interface.
Key Takeaways:
- Centralized visibility saves time - See all sites at a glance
- Remote management reduces support costs - No on-site visits needed
- Proactive monitoring prevents downtime - Alerts before users complain
- Audit trails provide accountability - Know who did what and when
- Security doesn’t have to be complex - Tailscale + JWT = simple and secure
The system has been running in production for several months, managing 40+ hotspot deployments with 99.9% uptime. It’s reduced our mean time to resolution (MTTR) from hours to minutes and given clients confidence that their networks are professionally monitored.
Resources
- FastAPI Documentation: https://fastapi.tiangolo.com/
- Tailscale Setup: https://tailscale.com/kb/
- PostgreSQL Performance: https://www.postgresql.org/docs/
- JWT Best Practices: https://jwt.io/introduction
- Chart.js Documentation: https://www.chartjs.org/docs/
✍️ Author
Implementation & integration by HacktheProtocol Infosec team.